
Do you know where your website visitors are coming from? What content do your visitors like the most? Is your website mobile-friendly? How can you improve your website’s speed? These are some of the many questions that can be answered by tracking analytics.
If you’re creating content, you want answers to these questions. In this blog post, we talk website analytics and why they are important. We highlight the important metrics that you should track and help you to put them in perspective. We also look at how Google Analytics works. So let’s dive in!
What Is Meant By Website Analytics?
Website analytics track the way your visitors behave when they visit your website. It is the process of collecting and analyzing web data to better understand web usage.
Why Are They Important?
How do you know if your campaign is working? How will you know what to improve next time? Analytics don’t just collect data. They can be used as a tool to improve website effectiveness.
If you have an e-commerce website, for example, analytics can help you understand why your sales are decreasing or increasing. You can see what your customers are doing, what items they are loading into the shopping carts and why they are not completing the purchase. Are they having difficulty loading their credit card details, etc? You will then have the opportunity to change your website to make it more user friendly.
Why Track Web Traffic Sources?
There are a few good reasons to track your web traffic:
- Better understand your web visitors – you can understand if your visitors are mostly male or female, what age group they are, are they searching for your content on desktop or mobile, etc.
- Measure your campaigns – as already mentioned, analytics are a great way to measure the success of your campaigns. Did you reach the number of people you wanted to? And if it didn’t work, why not?
- Focus on the best performing channel – you could be putting all your efforts on marketing to your clients on Facebook, only to discover that they spend more time on LinkedIn or Twitter. By analyzing your web’s referral channels, you can concentrate your efforts on the right channels.
- Find gaps on your website – find out which content or pages are not popular with your audience, then work on them to make them more useful to your visitors.
Types of Website Analytics
So let’s discuss the important data to measure on your website.
Audience Data
- Number of visitors – track the number of visitors to your website on a monthly, weekly or daily basis. See what drives visitors to your site by tracking a peak in numbers.
- Number of unique visitors – unique visitors are visitors that are coming to your website for the first time. You can distinguish between unique and returning visitors. You can then measure if your outreach efforts are working
- Country – If you have a local restaurant and the bulk of your web visitors are in another country, that’s not going to boost your sales. Should this be the case, you can easily find out and change tactics.
- Device – most people search for information on their mobile phones, even though they might complete a purchase on a laptop or desktop. If your website is not mobile-friendly, your visitors will get frustrated as they will not be able to navigate your site easily.
- Browser – are your visitors mostly on Google Chrome or Safari? For us, we use that information to test our campaigns and website to see if they look the same on different browsers
Audience Behaviour
- Common landing pages – a landing page is basically a page on your site that a visitors lands on first.
- Common exit pages – an exit page is the opposite of a landing page. It is the last page your visitors are on before exiting your website.
- Frequently visited pages – you will be able to see pages that visitors find most helpful. You will then be able to change the content on your less frequented pages to attract visitors.
- Length of time spent per visit (Engagement) – how long are your visitors spending on each page? This is another metric that can help you re-work those pages that are not getting a lot of traffic
- Number of pages per visit – Are your visitors visiting all the pages on your website or just concentrating on your landing page? If that’s the case, you can find a way to drive traffic to other pages with less traffic.
- Bounce rate – when your visitor lands on your website page and doesn’t go to any other page, we say they have bounced off your website. So a bounce rate calculates the percentage of visitors who land on your site and leave immediately. The lower the better!
Campaign Data
- Which campaign drove the most traffic – you can compare the traffic for each campaign. Where you get the most traffic, you can analyze what you did and implement that on your other campaigns.
- Which website referred the most traffic – when you promote your campaign on social media, you would typically use different social media platforms. This metric will indicate where your audience is and where you should focus the majority of your resources.
- Which keyword search resulted in a visit – you obviously have keywords that you are using that relate to your product or service. This metric will reveal which keywords your audience is using to find you.
- Conversion goals – most people think conversion is only a sale. A conversion can be any action you want your audience to take. If you want your audience to download an e-book for example, that can be a conversion. Or signing up for a newsletter.
These are the most widely tracked analytics, but by no means the only ones.
Website Analytics Tools
There are a few analytics tools out there. Some are free and some are subscription based. The data they offer is mostly the same, with a few exceptions here and there.
Today we take a look at the type of data that Google Analytics can give you. The best part, its free!
Google Analytics
Google Analytics is, in my opinion, one of the best analytics tools out there. Its easy to use and install, and highly customizable. It is full of great features, and like I said, it’s free
Set Up
The set up is fairly straightforward. You just sign up for a Google Analytics account and follow the instructions. Install the code into your website for it to start tracking.
This is how an account can be set up:
- You have one website and just need one account
- You have two websites, one for your travel blog and one for your hair salon business. in this case, set up two accounts. One under the business name and one under the travel blog.
- You have several businesses. In this case, you open an account for each of them so you can track the data easily
It’s not just your website data that can be tracked. If you have a mobile app, that data can be tracked too.
Standard Report
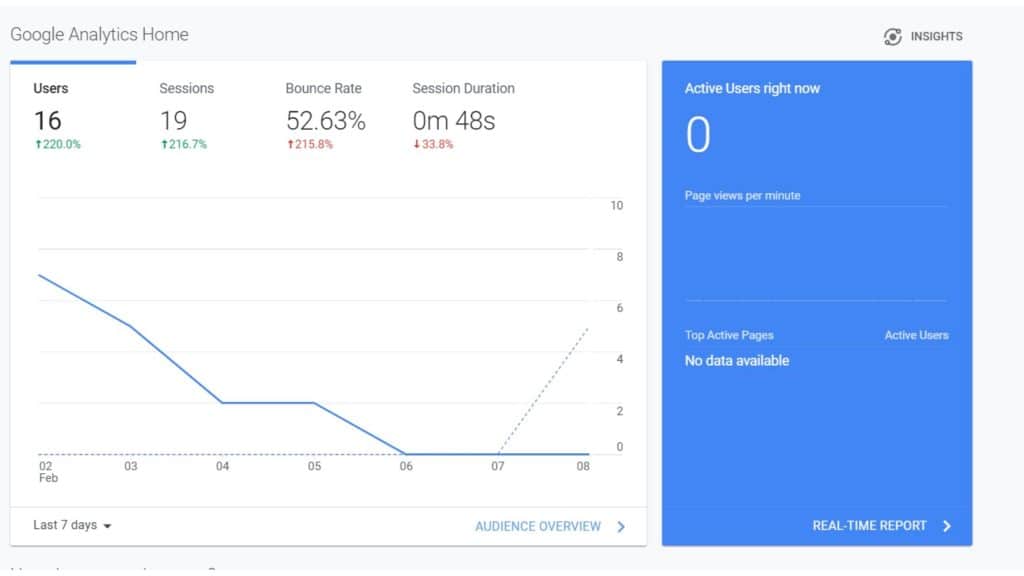
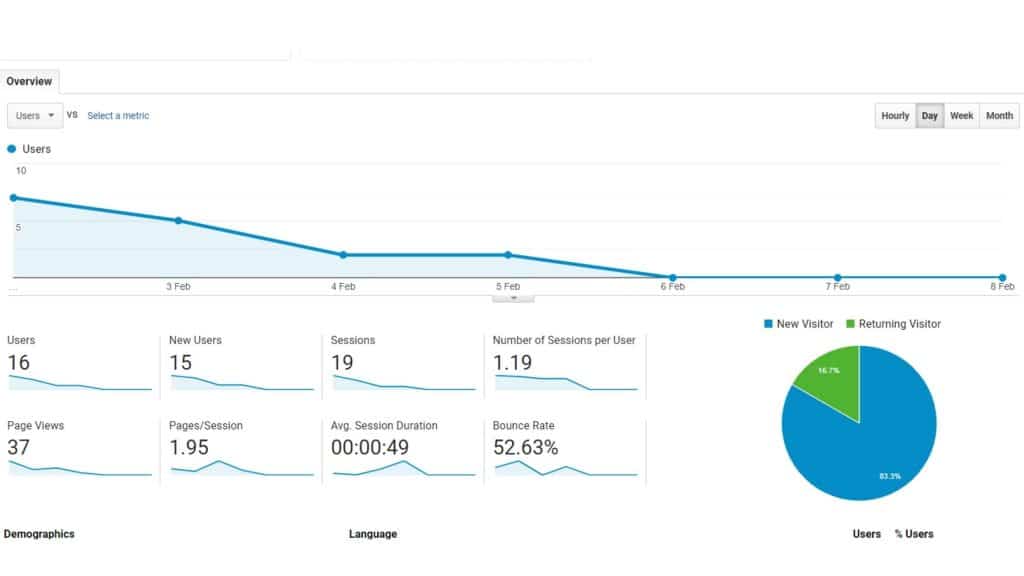
These reports are customizable, so the way the data is presented can be changed. You can switch between different website within your account, the report can show data for week or a month, etc
One important thing to remember, once you’ve set up your account and started tracking, you cannot back-date the start date. It starts tracking from the day it is set up. So the sooner you start, the better.
It’s A Wrapp!
Tracking your website data is not only helpful for marketing campaigns. It can help improve your website content and SEO. Finding out what your audience responds to is essential to all content creators.
Next week we focus on social media metrics.
Leave us a comment below and let us know which metrics you keep an eye on.